Expense Report
The Expense Report provides a complete financial overview of all school expenses. Filter by session year, category, and month to analyze spending patterns. The table includes a running total row at the bottom and supports export in multiple formats.
Category filter includes Salary
The Category dropdown includes both expense categories (Utilities, Maintenance, IT, etc.) and Salary — allowing you to view payroll costs alongside operational expenses.
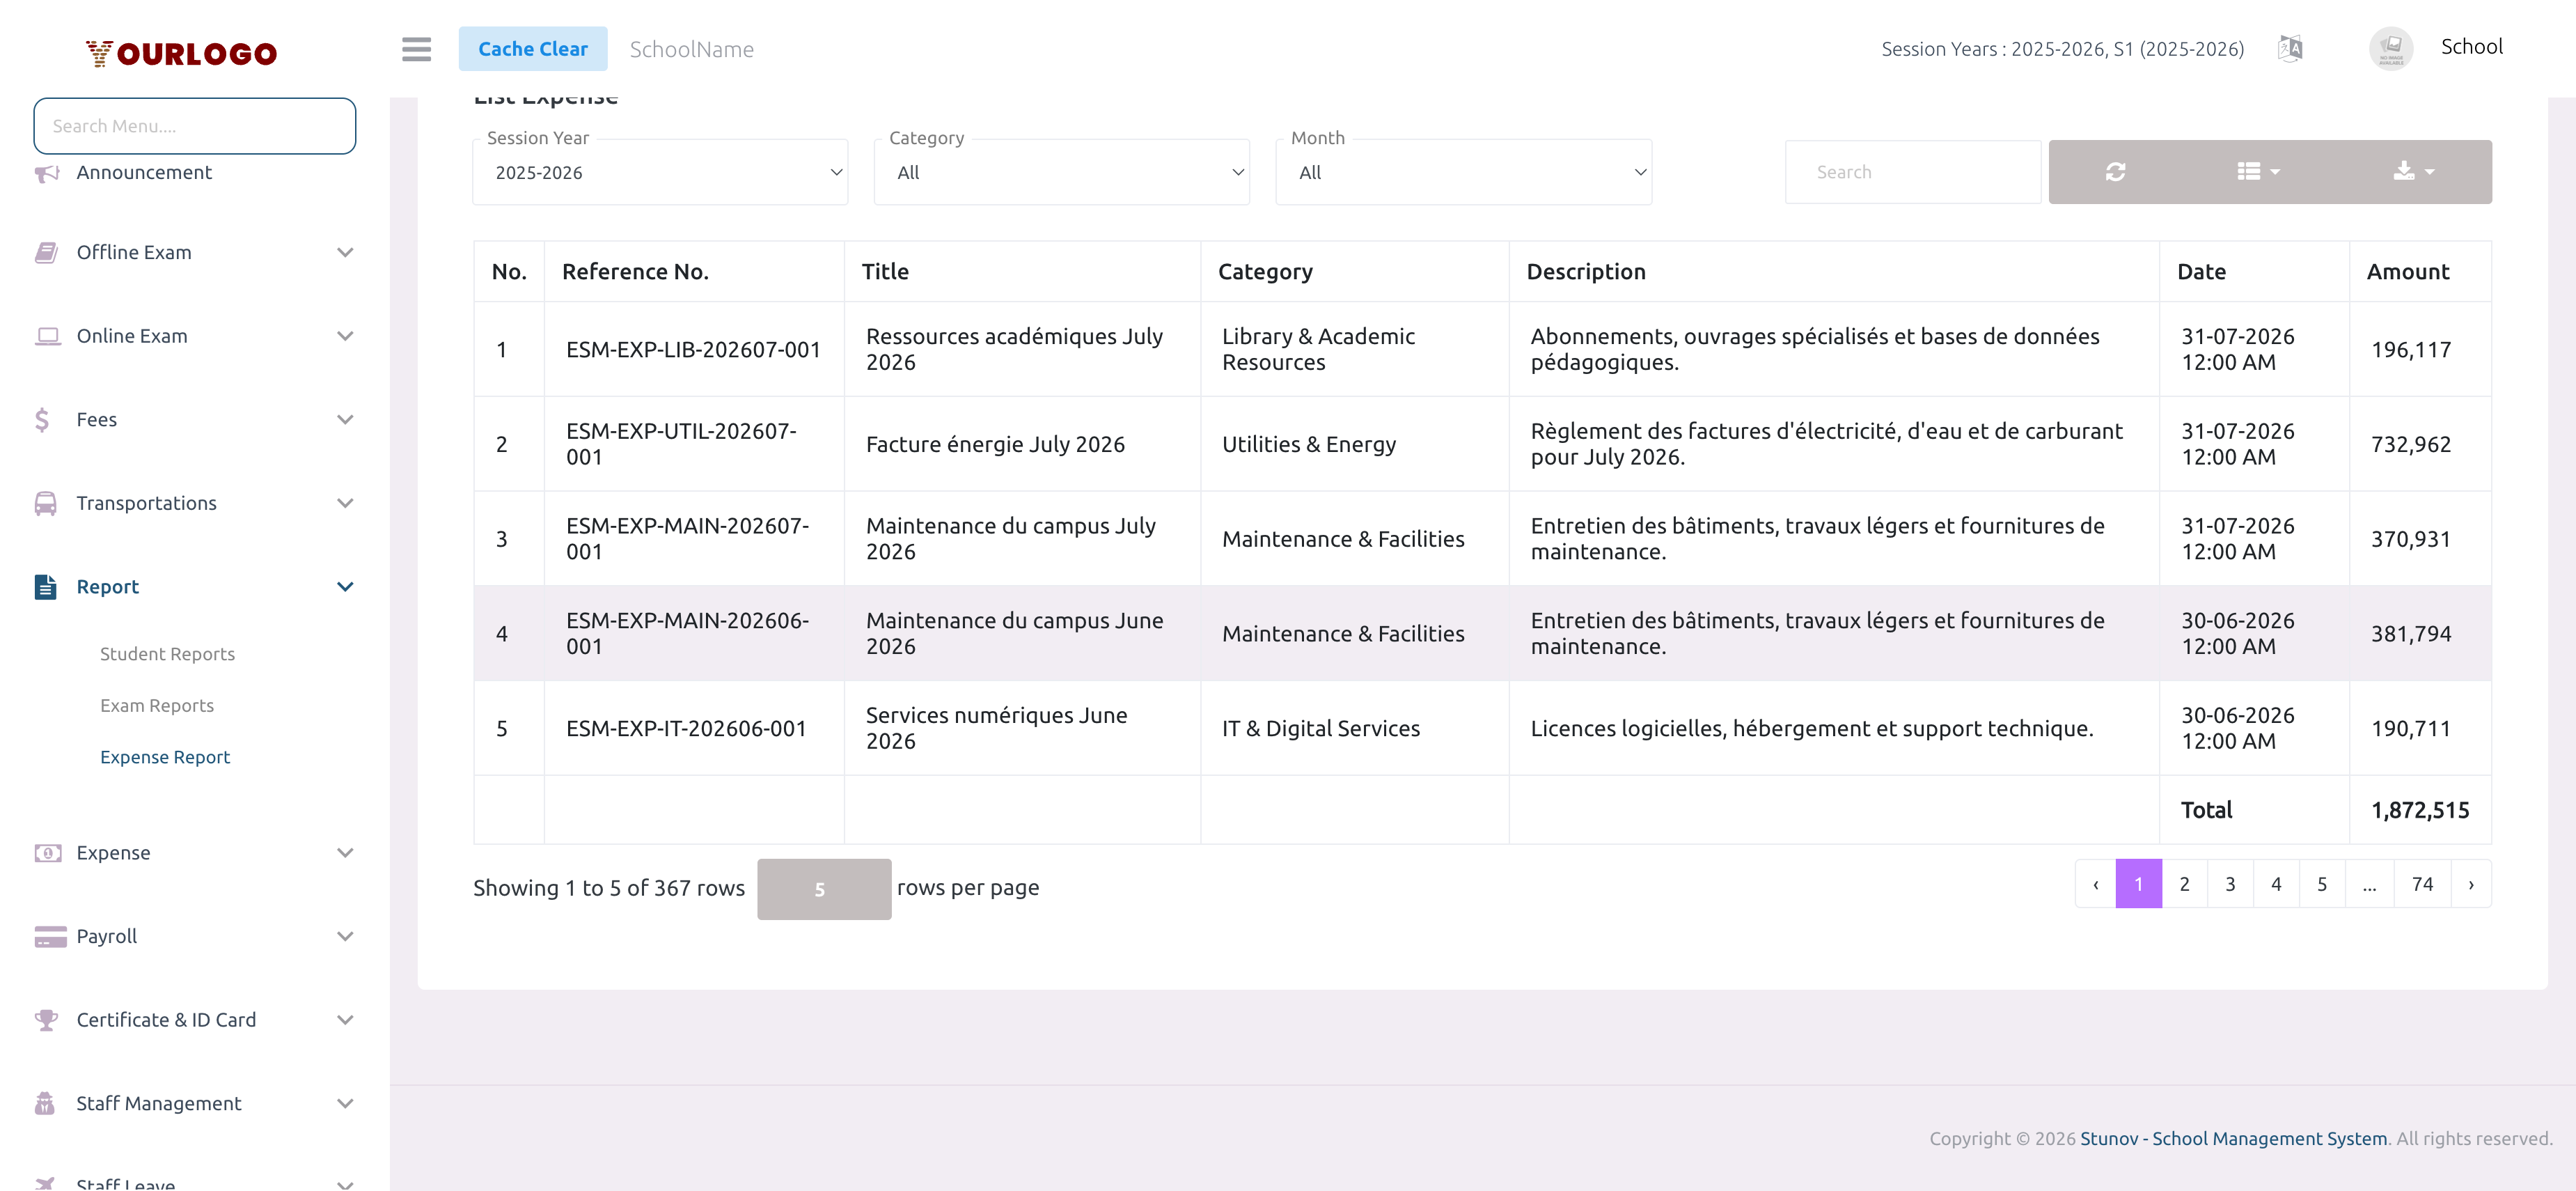
Expense Report — filter expenses by session year, category, and month with a total row at the bottom
Generate an Expense Report
1
Navigate to Reports & Analytics → Expense Report
From the sidebar, expand **Reports & Analytics** and click **Expense Report**. The expense list page opens with three filter dropdowns.
2
Select the Session Year
Choose the academic session year from the **Session Year** dropdown. Only expenses recorded within this session period are shown.
3
Filter by Category (optional)
Use the **Category** dropdown to narrow expenses to a specific type. Options include Utilities & Energy, Maintenance & Facilities, IT & Digital Services, Student Activities, Marketing & Outreach, Library & Academic Resources, Transportation & Fleet, and Salary. Select **All** to view everything.
4
Filter by Month (optional)
Select a specific month from the **Month** dropdown to view expenses for that month only. Select **All** for the full year.
5
Review the expense table
The table shows all matching expenses with reference numbers, titles, categories, descriptions, dates, and amounts. A **Total** row at the bottom sums all displayed amounts.
6
Export the report
Click the **Export** button to download the expense data. The exported file is named `expense-report-{date}` for easy organization.
Common Report Scenarios
Monthly budget review
- Set Session Year to the current year
- Select a specific Month (e.g., June)
- Leave Category as All
- The total row shows total spending for that month across all categories
Department-specific analysis
- Select a single Category (e.g., "IT & Digital Services")
- Leave Month as All
- Review how that category's spending trends across the year
Salary vs operational expenses
- Select Salary in the Category filter to isolate payroll costs
- Then switch to other categories to compare operational spending
- Export both for side-by-side comparison in a spreadsheet
Export Options
Click the Export button in the toolbar to download the expense data:
| Format | Use Case |
|---|---|
| Print-ready expense summary | |
| CSV | Spreadsheet import and analysis |
| Excel | Advanced pivot tables and charts |
| JSON | Programmatic data processing |
The exported file name includes the current date (e.g., expense-report-2026-02-23) for easy version tracking.
Related Pages
- Manage Expense — Create and manage individual expense records
- Manage Category — Configure expense categories
- Student Reports — Comprehensive student data reports
- Exam Reports — Academic performance analysis